Other posts
- 03 Mar 2022 » Job search is over, I'll be joining ActBlue
- 16 Feb 2022 » The perfect guest appearance (for me)
- 10 Feb 2022 » Bro do you even code
- 08 Feb 2022 » Boundaries
- 06 Feb 2022 » The perfect interview (for me)
- 26 Jan 2022 » Documenting my job search
- 08 Sep 2015 » XSS to RCE in ...
- 25 Jul 2014 » Twitter's CSP Report Collector
- 13 Dec 2013 » Automatic XSS Protection With CSP: No Changes Required
- 13 Jan 2013 » Removing Inline Javascript (for CSP)
Twitter's CSP Report Collector
We recently scrapped our previous CSP reporting endpoint and built a custom, single-purposed app. This is highly proprietary and will never be open sourced (do you run scribe, viz, logstash, etc???), but here are the building blocks of the design. This just launched a month or so ago, so I’m sure there is room to improve.
Normalization
The incoming data is very wacky. Various browsers with various levels of maturity with an infinite number versions in the wild create chaos. Here’s a few things we do to normalize the data.
pologies if some of this is not 100% accurate, I have forgotten the details of these quirks since they have been abstracted away.
- Firefox used to add ports to violated-directives and a few other fields. These are rarely useful and muddy the data as it won’t match any other user agent. Strip these unless you run on non-standard ports.
- Inline content is indicated by a blank blocked-uri, yet many browsers send “self” Change this to “” to be consistent.
- Strip www from document-uri host values. Unless you serve different content of course.
Send extra fields
The violation report has some data, but not everything I want. You can “smuggle” special values by adding them to the report-uri query string. I suggest adding the following fields:
- Application. Where did this come from? Use an opaque ID, or don’t. Revealing this information should not really matter.
- Was the policy enforced?
- What was the status code of the page? (might not be too valuable to most, but our reverse proxy replaces content for error pages)
Extract extra fields at index time
A blocked-uri is nice, but a blocked-host is better. This allows you to group reports much more effectively in logstash. That way, entries for https://www.example.org/* can be grouped as example.org violations. Here are all of the fields we extract:
- blocked-host: the blocked-uri with the scheme, www, port, and path removed (tbh the blocked-uri is otherwise useless and a potential violation of privacy).
- report-host: the document-uri with the scheme, www, port, and path removed
- classification1 : is this mixed content? inline script? unauthorized_host? this is not an exact science, but it’s useful.
- path: the path of the document-uri
- app_name: from the “extra fields above” – helpful if multiple apps are hosted on one domain.
- report_only – useful coordination and for boss-type people
- violation-type: the first token in the violated directive – helpful if your policy varies within an app.
- browser, browser + major version: take the user-agent, but normalize the values into easily defined buckets. This is very useful for classifying plugin noise. . operating system (may indicate malware)
1 Pseudo code for the classification:
Filter Noise
This is probably the most important thing to do, and it builds off of the ideas mentioned above. This is even less of a science than classifying reports. These reports are not counted in most statistics and are not sent to logstash. We still log them, but to a different location and we will use this data to help browser vendors. Are we overzealous with our filtering? Probably.
We’re filtering ~80% of our reports!
We consider anything that we deem as “unactionable” or “too old” as noise. This noise come from plugins mostly, but also comes from other strange sources such as proxy sites that replay our CSP. Strange. The quality of the reports improve over time, so we started filtering out reports that were old than some arbitrary cutoff point in versioning.
I’ll just drop this bit of scala code for ya. It’s ugly. monads or something. This list grows by the week.
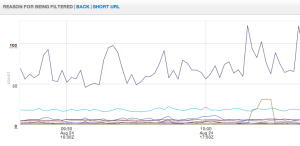
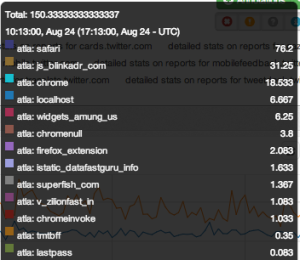
And here’s a graph of our filtered report data:
 |
|---|
| Reason for being filtered |
 |
|
|---|---|
| Legend for the graph of filtered reports |
Now we can get to business
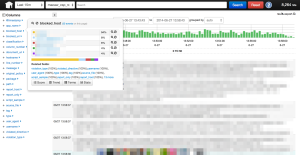
Now that we’ve normalized and filtered our data, we can get to work! We use logstash to dive into reports. The main feature we use is field extractions where we take all of the “extra fields” to logstash so we can quickly dive into reports.
 |
|---|
| Logstash reports |
OK, so how do I look at the mixed content violations for twitter.com, specifically the old rails code?
I search for:
classification:”mixed_content” app_name: monorail blocked_host:twimg.com OR blocked_host:twitter.com violated_directive:script-src app_name:translate.twitter.com
Now I can look at the various fields on the left and keep on digging! Logstash is awesome.
Now show your work
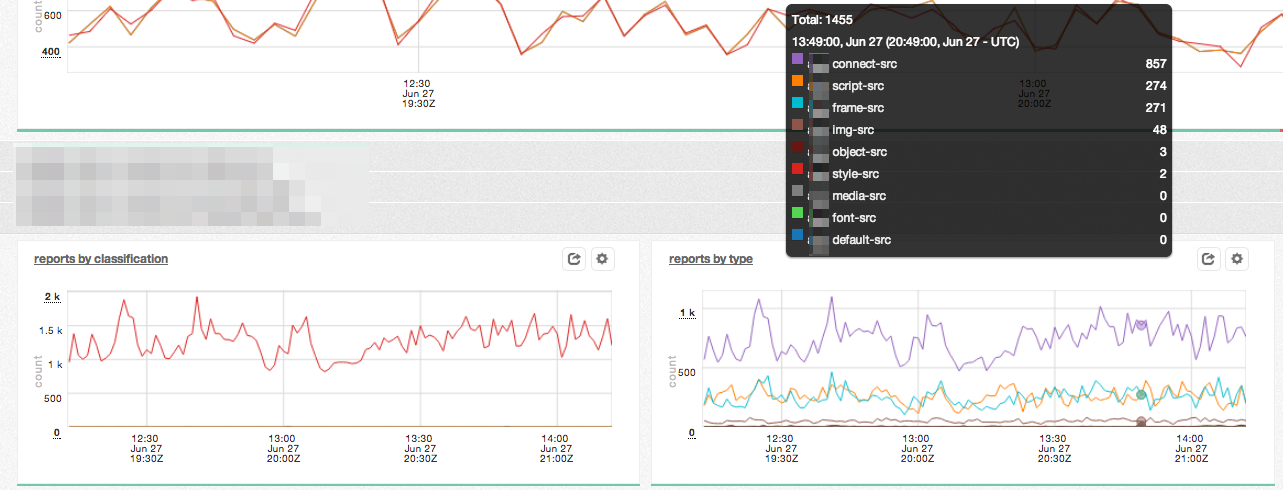
For each application in our stack, we provided two simple graphs that allow people to take a quick glance at the state of things.
 |
|---|
| Reports by classification and violated directive, per application |